![]()
Pandas TA - A Technical Analysis Library in Python 3


![]()


![]()
Pandas Technical Analysis (Pandas TA) is an easy to use library that leverages the Pandas package with more than 130 Indicators and Utility functions and more than 60 TA Lib Candlestick Patterns. Many commonly used indicators are included, such as: Candle Pattern(cdl_pattern), Simple Moving Average (sma) Moving Average Convergence Divergence (macd), Hull Exponential Moving Average (hma), Bollinger Bands (bbands), On-Balance Volume (obv), Aroon & Aroon Oscillator (aroon), Squeeze (squeeze) and many more.
Note: TA Lib must be installed to use all the Candlestick Patterns. pip install TA-Lib. If TA Lib is not installed, then only the builtin Candlestick Patterns will be available.
Table of contents
- Features
- Installation
- Quick Start
- Help
- Issues and Contributions
- Programming Conventions
- Pandas TA Strategies
- DataFrame Properties
- DataFrame Methods
- Indicators by Category
- Performance Metrics
- Changes
- Sources
- Support
Features
- Has 130+ indicators and utility functions.
- BETA Also Pandas TA will run TA Lib’s version, this includes TA Lib’s 63 Chart Patterns.
- Indicators in Python are tightly correlated with the de facto TA Lib if they share common indicators.
- If TA Lib is also installed, TA Lib computations are enabled by default but can be disabled disabled per indicator by using the argument
talib=False.- For instance to disable TA Lib calculation for stdev:
ta.stdev(df["close"], length=30, talib=False).
- For instance to disable TA Lib calculation for stdev:
- NEW! Include External Custom Indicators independent of the builtin Pandas TA indicators. For more information, see
import_dirdocumentation under/pandas_ta/custom.py. - Example Jupyter Notebook with vectorbt Portfolio Backtesting with Pandas TA’s
ta.tsignalsmethod. - Have the need for speed? By using the DataFrame strategy method, you get multiprocessing for free! Conditions permitting.
- Easily add prefixes or suffixes or both to columns names. Useful for Custom Chained Strategies.
- Example Jupyter Notebooks under the examples directory, including how to create Custom Strategies using the new Strategy Class
- Potential Data Leaks: dpo and ichimoku. See indicator list below for details. Set
lookahead=Falseto disable.
Under Development
Pandas TA checks if the user has some common trading packages installed including but not limited to: TA Lib, Vector BT, YFinance … Much of which is experimental and likely to break until it stabilizes more.
- If TA Lib installed, existing indicators will eventually get a TA Lib version.
- Easy Downloading of ohlcv data using yfinance. See
help(ta.ticker)andhelp(ta.yf)and examples below. - Some Common Performance Metrics
Installation
Stable
The pip version is the last stable release. Version: 0.3.14b
$ pip install pandas_ta
Latest Version
Best choice! Version: 0.3.14b
- Includes all fixes and updates between pypi and what is covered in this README.
$ pip install -U git+https://github.com/twopirllc/pandas-ta
Cutting Edge
This is the Development Version which could have bugs and other undesireable side effects. Use at own risk!
$ pip install -U git+https://github.com/twopirllc/pandas-ta.git@development
# Quick Start
import pandas as pd
import pandas_ta as ta

df = pd.DataFrame() # Empty DataFrame

# Load data
df = pd.read_csv("path/to/symbol.csv", sep=",")
# OR if you have yfinance installed
df = df.ta.ticker("aapl")

# VWAP requires the DataFrame index to be a DatetimeIndex.
# Replace "datetime" with the appropriate column from your DataFrame
df.set_index(pd.DatetimeIndex(df["datetime"]), inplace=True)

# Calculate Returns and append to the df DataFrame
df.ta.log_return(cumulative=True, append=True)
df.ta.percent_return(cumulative=True, append=True)

# New Columns with results
df.columns

# Take a peek
df.tail()

# vv Continue Post Processing vv
Help
Some indicator arguments have been reordered for consistency. Use help(ta.indicator_name) for more information or make a Pull Request to improve documentation.
import pandas as pd
import pandas_ta as ta

# Create a DataFrame so 'ta' can be used.
df = pd.DataFrame()

# Help about this, 'ta', extension
help(df.ta)

# List of all indicators
df.ta.indicators()

# Help about an indicator such as bbands
help(ta.bbands)
Issues and Contributions
Thanks for using Pandas TA!
-
Comments and Feedback
- Have you read this document?
- Are you running the latest version?
$ pip install -U git+https://github.com/twopirllc/pandas-ta
- Have you tried the Examples?
- Did they help?
- What is missing?
- Could you help improve them?
- Did you know you can easily build Custom Strategies with the Strategy Class?
- Documentation could always be improved. Can you help contribute?
-
Bugs, Indicators or Feature Requests
- First, search the Closed Issues before you Open a new Issue; it may have already been solved.
- Please be as detailed as possible with reproducible code, links if any, applicable screenshots, errors, logs, and data samples. You will be asked again if you provide nothing.
- You want a new indicator not currently listed.
- You want an alternate version of an existing indicator.
- The indicator does not match another website, library, broker platform, language, et al.
- Do you have correlation analysis to back your claim?
- Can you contribute?
- You will be asked to fill out an Issue even if you email my personally.
Contributors
Thank you for your contributions!
Programming Conventions
Pandas TA has three primary “styles” of processing Technical Indicators for your use case and/or requirements. They are: Standard, DataFrame Extension, and the Pandas TA Strategy. Each with increasing levels of abstraction for ease of use. As you become more familiar with Pandas TA, the simplicity and speed of using a Pandas TA Strategy may become more apparent. Furthermore, you can create your own indicators through Chaining or Composition. Lastly, each indicator either returns a Series or a DataFrame in Uppercase Underscore format regardless of style.
Standard
You explicitly define the input columns and take care of the output.
sma10 = ta.sma(df["Close"], length=10)- Returns a Series with name:
SMA_10
- Returns a Series with name:
donchiandf = ta.donchian(df["HIGH"], df["low"], lower_length=10, upper_length=15)- Returns a DataFrame named
DC_10_15and column names:DCL_10_15, DCM_10_15, DCU_10_15
- Returns a DataFrame named
ema10_ohlc4 = ta.ema(ta.ohlc4(df["Open"], df["High"], df["Low"], df["Close"]), length=10)- Chaining indicators is possible but you have to be explicit.
- Since it returns a Series named
EMA_10. If needed, you may need to uniquely name it.
Pandas TA DataFrame Extension
Calling df.ta will automatically lowercase OHLCVA to ohlcva: open, high, low, close, volume, adj_close. By default, df.ta will use the ohlcva for the indicator arguments removing the need to specify input columns directly.
sma10 = df.ta.sma(length=10)- Returns a Series with name:
SMA_10
- Returns a Series with name:
ema10_ohlc4 = df.ta.ema(close=df.ta.ohlc4(), length=10, suffix="OHLC4")- Returns a Series with name:
EMA_10_OHLC4 - Chaining Indicators require specifying the input like:
close=df.ta.ohlc4().
- Returns a Series with name:
donchiandf = df.ta.donchian(lower_length=10, upper_length=15)- Returns a DataFrame named
DC_10_15and column names:DCL_10_15, DCM_10_15, DCU_10_15
- Returns a DataFrame named
Same as the last three examples, but appending the results directly to the DataFrame df.
df.ta.sma(length=10, append=True)- Appends to
dfcolumn name:SMA_10.
- Appends to
df.ta.ema(close=df.ta.ohlc4(append=True), length=10, suffix="OHLC4", append=True)- Chaining Indicators require specifying the input like:
close=df.ta.ohlc4().
- Chaining Indicators require specifying the input like:
df.ta.donchian(lower_length=10, upper_length=15, append=True)- Appends to
dfwith column names:DCL_10_15, DCM_10_15, DCU_10_15.
- Appends to
Pandas TA Strategy
A Pandas TA Strategy is a named group of indicators to be run by the strategy method. All Strategies use mulitprocessing except when using the col_names parameter (see below). There are different types of Strategies listed in the following section.
Here are the previous Styles implemented using a Strategy Class:
# (1) Create the Strategy
MyStrategy = ta.Strategy(
    name="DCSMA10",
    ta=[
        {"kind": "ohlc4"},
        {"kind": "sma", "length": 10},
        {"kind": "donchian", "lower_length": 10, "upper_length": 15},
        {"kind": "ema", "close": "OHLC4", "length": 10, "suffix": "OHLC4"},
    ]
)

# (2) Run the Strategy
df.ta.strategy(MyStrategy, **kwargs)
Pandas TA Strategies
The Strategy Class is a simple way to name and group your favorite TA Indicators by using a Data Class. Pandas TA comes with two prebuilt basic Strategies to help you get started: AllStrategy and CommonStrategy. A Strategy can be as simple as the CommonStrategy or as complex as needed using Composition/Chaining.
- When using the strategy method, all indicators will be automatically appended to the DataFrame
df. - You are using a Chained Strategy when you have the output of one indicator as input into one or more indicators in the same Strategy.
- Note: Use the ‘prefix’ and/or ‘suffix’ keywords to distinguish the composed indicator from it’s default Series.
See the Pandas TA Strategy Examples Notebook for examples including Indicator Composition/Chaining.
Strategy Requirements
- name: Some short memorable string. Note: Case-insensitive “All” is reserved.
- ta: A list of dicts containing keyword arguments to identify the indicator and the indicator’s arguments
- Note: A Strategy will fail when consumed by Pandas TA if there is no
{"kind": "indicator name"}attribute. Remember to check your spelling.
Optional Parameters
- description: A more detailed description of what the Strategy tries to capture. Default: None
- created: At datetime string of when it was created. Default: Automatically generated.
Types of Strategies
Builtin
# Running the Builtin CommonStrategy as mentioned above
df.ta.strategy(ta.CommonStrategy)

# The Default Strategy is the ta.AllStrategy. The following are equivalent:
df.ta.strategy()
df.ta.strategy("All")
df.ta.strategy(ta.AllStrategy)
Categorical
# List of indicator categories
df.ta.categories

# Running a Categorical Strategy only requires the Category name
df.ta.strategy("Momentum") # Default values for all Momentum indicators
df.ta.strategy("overlap", length=42) # Override all Overlap 'length' attributes
Custom
# Create your own Custom Strategy
CustomStrategy = ta.Strategy(
    name="Momo and Volatility",
    description="SMA 50,200, BBANDS, RSI, MACD and Volume SMA 20",
    ta=[
        {"kind": "sma", "length": 50},
        {"kind": "sma", "length": 200},
        {"kind": "bbands", "length": 20},
        {"kind": "rsi"},
        {"kind": "macd", "fast": 8, "slow": 21},
        {"kind": "sma", "close": "volume", "length": 20, "prefix": "VOLUME"},
    ]
)
# To run your "Custom Strategy"
df.ta.strategy(CustomStrategy)
Multiprocessing
The Pandas TA strategy method utilizes multiprocessing for bulk indicator processing of all Strategy types with ONE EXCEPTION! When using the col_names parameter to rename resultant column(s), the indicators in ta array will be ran in order.
# VWAP requires the DataFrame index to be a DatetimeIndex.
# * Replace "datetime" with the appropriate column from your DataFrame
df.set_index(pd.DatetimeIndex(df["datetime"]), inplace=True)

# Runs and appends all indicators to the current DataFrame by default
# The resultant DataFrame will be large.
df.ta.strategy()
# Or the string "all"
df.ta.strategy("all")
# Or the ta.AllStrategy
df.ta.strategy(ta.AllStrategy)

# Use verbose if you want to make sure it is running.
df.ta.strategy(verbose=True)

# Use timed if you want to see how long it takes to run.
df.ta.strategy(timed=True)

# Choose the number of cores to use. Default is all available cores.
# For no multiprocessing, set this value to 0.
df.ta.cores = 4

# Maybe you do not want certain indicators.
# Just exclude (a list of) them.
df.ta.strategy(exclude=["bop", "mom", "percent_return", "wcp", "pvi"], verbose=True)

# Perhaps you want to use different values for indicators.
# This will run ALL indicators that have fast or slow as parameters.
# Check your results and exclude as necessary.
df.ta.strategy(fast=10, slow=50, verbose=True)

# Sanity check. Make sure all the columns are there
df.columns
Custom Strategy without Multiprocessing
Remember These will not be utilizing multiprocessing
NonMPStrategy = ta.Strategy(
    name="EMAs, BBs, and MACD",
    description="Non Multiprocessing Strategy by rename Columns",
    ta=[
        {"kind": "ema", "length": 8},
        {"kind": "ema", "length": 21},
        {"kind": "bbands", "length": 20, "col_names": ("BBL", "BBM", "BBU")},
        {"kind": "macd", "fast": 8, "slow": 21, "col_names": ("MACD", "MACD_H", "MACD_S")}
    ]
)
# Run it
df.ta.strategy(NonMPStrategy)
DataFrame Properties
adjusted
# Set ta to default to an adjusted column, 'adj_close', overriding default 'close'.
df.ta.adjusted = "adj_close"
df.ta.sma(length=10, append=True)

# To reset back to 'close', set adjusted back to None.
df.ta.adjusted = None
categories
# List of Pandas TA categories.
df.ta.categories
cores
# Set the number of cores to use for strategy multiprocessing
# Defaults to the number of cpus you have.
df.ta.cores = 4

# Set the number of cores to 0 for no multiprocessing.
df.ta.cores = 0

# Returns the number of cores you set or your default number of cpus.
df.ta.cores
datetime_ordered
# The 'datetime_ordered' property returns True if the DataFrame
# index is of Pandas datetime64 and df.index[0] < df.index[-1].
# Otherwise it returns False.
df.ta.datetime_ordered
exchange
# Sets the Exchange to use when calculating the last_run property. Default: "NYSE"
df.ta.exchange

# Set the Exchange to use.
# Available Exchanges: "ASX", "BMF", "DIFX", "FWB", "HKE", "JSE", "LSE", "NSE", "NYSE", "NZSX", "RTS", "SGX", "SSE", "TSE", "TSX"
df.ta.exchange = "LSE"
last_run
# Returns the time Pandas TA was last run as a string.
df.ta.last_run
reverse
# The 'reverse' is a helper property that returns the DataFrame
# in reverse order.
df.ta.reverse
prefix & suffix
# Applying a prefix to the name of an indicator.
prehl2 = df.ta.hl2(prefix="pre")
print(prehl2.name)  # "pre_HL2"

# Applying a suffix to the name of an indicator.
endhl2 = df.ta.hl2(suffix="post")
print(endhl2.name)  # "HL2_post"

# Applying a prefix and suffix to the name of an indicator.
bothhl2 = df.ta.hl2(prefix="pre", suffix="post")
print(bothhl2.name)  # "pre_HL2_post"
time_range
# Returns the time range of the DataFrame as a float.
# By default, it returns the time in "years"
df.ta.time_range

# Available time_ranges include: "years", "months", "weeks", "days", "hours", "minutes". "seconds"
df.ta.time_range = "days"
df.ta.time_range # prints DataFrame time in "days" as float
to_utc
# Sets the DataFrame index to UTC format.
df.ta.to_utc
DataFrame Methods
constants
import numpy as np

# Add constant '1' to the DataFrame
df.ta.constants(True, [1])
# Remove constant '1' to the DataFrame
df.ta.constants(False, [1])

# Adding constants for charting
import numpy as np
chart_lines = np.append(np.arange(-4, 5, 1), np.arange(-100, 110, 10))
df.ta.constants(True, chart_lines)
# Removing some constants from the DataFrame
df.ta.constants(False, np.array([-60, -40, 40, 60]))
indicators
# Prints the indicators and utility functions
df.ta.indicators()

# Returns a list of indicators and utility functions
ind_list = df.ta.indicators(as_list=True)

# Prints the indicators and utility functions that are not in the excluded list
df.ta.indicators(exclude=["cg", "pgo", "ui"])
# Returns a list of the indicators and utility functions that are not in the excluded list
smaller_list = df.ta.indicators(exclude=["cg", "pgo", "ui"], as_list=True)
ticker
# Download Chart history using yfinance. (pip install yfinance) https://github.com/ranaroussi/yfinance
# It uses the same keyword arguments as yfinance (excluding start and end)
df = df.ta.ticker("aapl") # Default ticker is "SPY"

# Period is used instead of start/end
# Valid periods: 1d,5d,1mo,3mo,6mo,1y,2y,5y,10y,ytd,max
# Default: "max"
df = df.ta.ticker("aapl", period="1y") # Gets this past year

# History by Interval by interval (including intraday if period < 60 days)
# Valid intervals: 1m,2m,5m,15m,30m,60m,90m,1h,1d,5d,1wk,1mo,3mo
# Default: "1d"
df = df.ta.ticker("aapl", period="1y", interval="1wk") # Gets this past year in weeks
df = df.ta.ticker("aapl", period="1mo", interval="1h") # Gets this past month in hours

# BUT WAIT!! THERE'S MORE!!
help(ta.yf)
Indicators (by Category)
Candles (64)
Patterns that are not bold, require TA-Lib to be installed: pip install TA-Lib
- 2crows
- 3blackcrows
- 3inside
- 3linestrike
- 3outside
- 3starsinsouth
- 3whitesoldiers
- abandonedbaby
- advanceblock
- belthold
- breakaway
- closingmarubozu
- concealbabyswall
- counterattack
- darkcloudcover
- doji
- dojistar
- dragonflydoji
- engulfing
- eveningdojistar
- eveningstar
- gapsidesidewhite
- gravestonedoji
- hammer
- hangingman
- harami
- haramicross
- highwave
- hikkake
- hikkakemod
- homingpigeon
- identical3crows
- inneck
- inside
- invertedhammer
- kicking
- kickingbylength
- ladderbottom
- longleggeddoji
- longline
- marubozu
- matchinglow
- mathold
- morningdojistar
- morningstar
- onneck
- piercing
- rickshawman
- risefall3methods
- separatinglines
- shootingstar
- shortline
- spinningtop
- stalledpattern
- sticksandwich
- takuri
- tasukigap
- thrusting
- tristar
- unique3river
- upsidegap2crows
- xsidegap3methods
- Heikin-Ashi: ha
- Z Score: cdl_z
```python
Get all candle patterns (This is the default behaviour)
df = df.ta.cdl_pattern(name=”all”)
Get only one pattern
df = df.ta.cdl_pattern(name=”doji”)
Get some patterns
df = df.ta.cdl_pattern(name=[“doji”, “inside”])
<br/>
### **Cycles** (1)
* _Even Better Sinewave_: **ebsw**
<br/>
### **Momentum** (41)
* _Awesome Oscillator_: **ao**
* _Absolute Price Oscillator_: **apo**
* _Bias_: **bias**
* _Balance of Power_: **bop**
* _BRAR_: **brar**
* _Commodity Channel Index_: **cci**
* _Chande Forecast Oscillator_: **cfo**
* _Center of Gravity_: **cg**
* _Chande Momentum Oscillator_: **cmo**
* _Coppock Curve_: **coppock**
* _Correlation Trend Indicator_: **cti**
* A wrapper for ```ta.linreg(series, r=True)```
* _Directional Movement_: **dm**
* _Efficiency Ratio_: **er**
* _Elder Ray Index_: **eri**
* _Fisher Transform_: **fisher**
* _Inertia_: **inertia**
* _KDJ_: **kdj**
* _KST Oscillator_: **kst**
* _Moving Average Convergence Divergence_: **macd**
* _Momentum_: **mom**
* _Pretty Good Oscillator_: **pgo**
* _Percentage Price Oscillator_: **ppo**
* _Psychological Line_: **psl**
* _Percentage Volume Oscillator_: **pvo**
* _Quantitative Qualitative Estimation_: **qqe**
* _Rate of Change_: **roc**
* _Relative Strength Index_: **rsi**
* _Relative Strength Xtra_: **rsx**
* _Relative Vigor Index_: **rvgi**
* _Schaff Trend Cycle_: **stc**
* _Slope_: **slope**
* _SMI Ergodic_ **smi**
* _Squeeze_: **squeeze**
* Default is John Carter's. Enable Lazybear's with ```lazybear=True```
* _Squeeze Pro_: **squeeze_pro**
* _Stochastic Oscillator_: **stoch**
* _Stochastic RSI_: **stochrsi**
* _TD Sequential_: **td_seq**
* Excluded from ```df.ta.strategy()```.
* _Trix_: **trix**
* _True strength index_: **tsi**
* _Ultimate Oscillator_: **uo**
* _Williams %R_: **willr**
| _Moving Average Convergence Divergence_ (MACD) |
|:--------:|
| 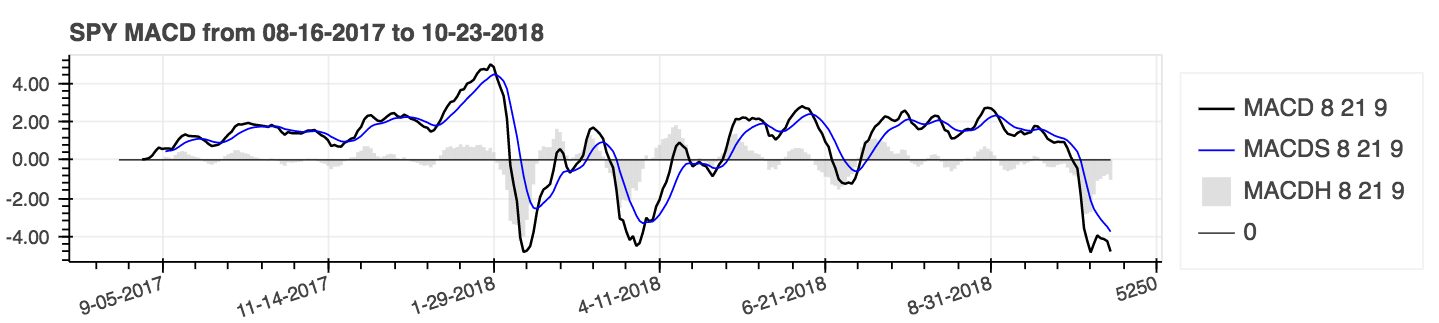 |
<br/>
### **Overlap** (33)
* _Arnaud Legoux Moving Average_: **alma**
* _Double Exponential Moving Average_: **dema**
* _Exponential Moving Average_: **ema**
* _Fibonacci's Weighted Moving Average_: **fwma**
* _Gann High-Low Activator_: **hilo**
* _High-Low Average_: **hl2**
* _High-Low-Close Average_: **hlc3**
* Commonly known as 'Typical Price' in Technical Analysis literature
* _Hull Exponential Moving Average_: **hma**
* _Holt-Winter Moving Average_: **hwma**
* _Ichimoku Kinkō Hyō_: **ichimoku**
* Returns two DataFrames. For more information: ```help(ta.ichimoku)```.
* ```lookahead=False``` drops the Chikou Span Column to prevent potential data leak.
* _Jurik Moving Average_: **jma**
* _Kaufman's Adaptive Moving Average_: **kama**
* _Linear Regression_: **linreg**
* _McGinley Dynamic_: **mcgd**
* _Midpoint_: **midpoint**
* _Midprice_: **midprice**
* _Open-High-Low-Close Average_: **ohlc4**
* _Pascal's Weighted Moving Average_: **pwma**
* _WildeR's Moving Average_: **rma**
* _Sine Weighted Moving Average_: **sinwma**
* _Simple Moving Average_: **sma**
* _Ehler's Super Smoother Filter_: **ssf**
* _Supertrend_: **supertrend**
* _Symmetric Weighted Moving Average_: **swma**
* _T3 Moving Average_: **t3**
* _Triple Exponential Moving Average_: **tema**
* _Triangular Moving Average_: **trima**
* _Variable Index Dynamic Average_: **vidya**
* _Volume Weighted Average Price_: **vwap**
* **Requires** the DataFrame index to be a DatetimeIndex
* _Volume Weighted Moving Average_: **vwma**
* _Weighted Closing Price_: **wcp**
* _Weighted Moving Average_: **wma**
* _Zero Lag Moving Average_: **zlma**
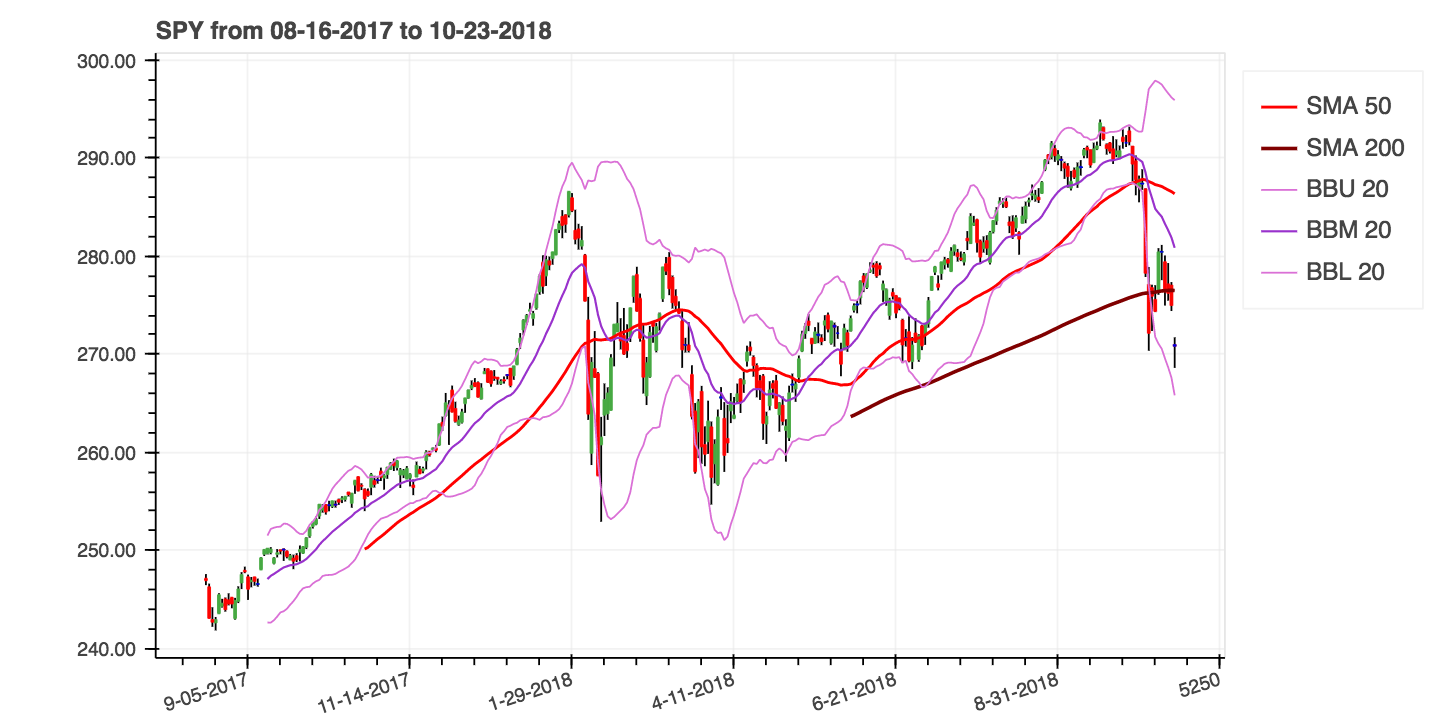
| _Simple Moving Averages_ (SMA) and _Bollinger Bands_ (BBANDS) |
|:--------:|
|  |
<br/>
### **Performance** (3)
Use parameter: cumulative=**True** for cumulative results.
* _Draw Down_: **drawdown**
* _Log Return_: **log_return**
* _Percent Return_: **percent_return**
| _Percent Return_ (Cumulative) with _Simple Moving Average_ (SMA) |
|:--------:|
| 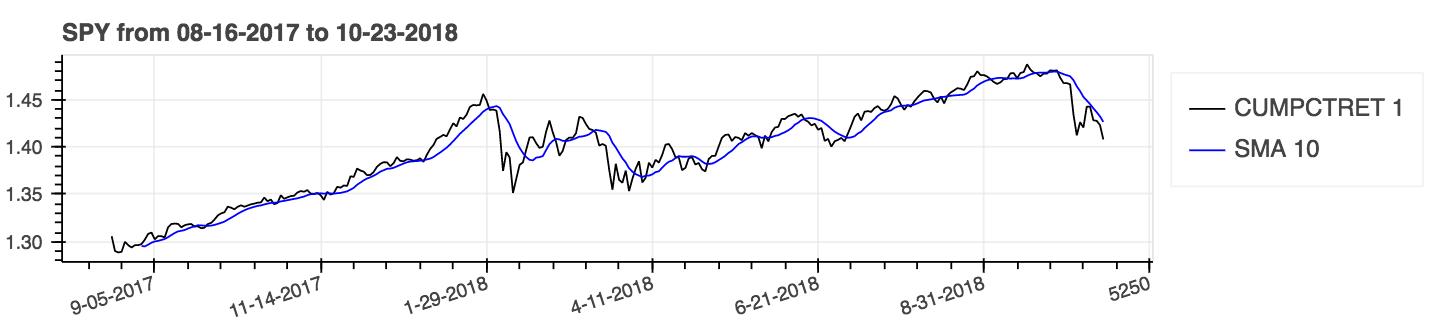 |
<br/>
### **Statistics** (11)
* _Entropy_: **entropy**
* _Kurtosis_: **kurtosis**
* _Mean Absolute Deviation_: **mad**
* _Median_: **median**
* _Quantile_: **quantile**
* _Skew_: **skew**
* _Standard Deviation_: **stdev**
* _Think or Swim Standard Deviation All_: **tos_stdevall**
* _Variance_: **variance**
* _Z Score_: **zscore**
| _Z Score_ |
|:--------:|
| 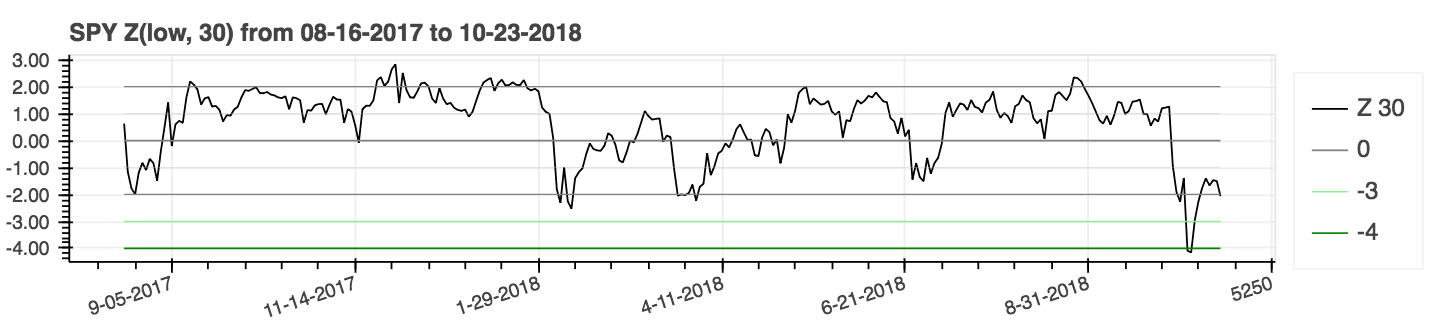 |
<br/>
### **Trend** (18)
* _Average Directional Movement Index_: **adx**
* Also includes **dmp** and **dmn** in the resultant DataFrame.
* _Archer Moving Averages Trends_: **amat**
* _Aroon & Aroon Oscillator_: **aroon**
* _Choppiness Index_: **chop**
* _Chande Kroll Stop_: **cksp**
* _Decay_: **decay**
* Formally: **linear_decay**
* _Decreasing_: **decreasing**
* _Detrended Price Oscillator_: **dpo**
* Set ```lookahead=False``` to disable centering and remove potential data leak.
* _Increasing_: **increasing**
* _Long Run_: **long_run**
* _Parabolic Stop and Reverse_: **psar**
* _Q Stick_: **qstick**
* _Short Run_: **short_run**
* _Trend Signals_: **tsignals**
* _TTM Trend_: **ttm_trend**
* _Vertical Horizontal Filter_: **vhf**
* _Vortex_: **vortex**
* _Cross Signals_: **xsignals**
| _Average Directional Movement Index_ (ADX) |
|:--------:|
| 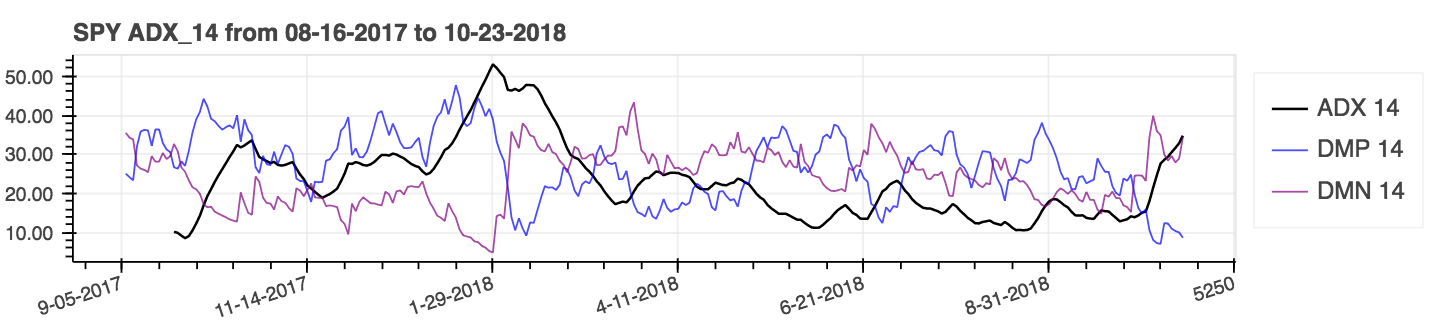 |
<br/>
### **Utility** (5)
* _Above_: **above**
* _Above Value_: **above_value**
* _Below_: **below**
* _Below Value_: **below_value**
* _Cross_: **cross**
<br/>
### **Volatility** (14)
* _Aberration_: **aberration**
* _Acceleration Bands_: **accbands**
* _Average True Range_: **atr**
* _Bollinger Bands_: **bbands**
* _Donchian Channel_: **donchian**
* _Holt-Winter Channel_: **hwc**
* _Keltner Channel_: **kc**
* _Mass Index_: **massi**
* _Normalized Average True Range_: **natr**
* _Price Distance_: **pdist**
* _Relative Volatility Index_: **rvi**
* _Elder's Thermometer_: **thermo**
* _True Range_: **true_range**
* _Ulcer Index_: **ui**
| _Average True Range_ (ATR) |
|:--------:|
| 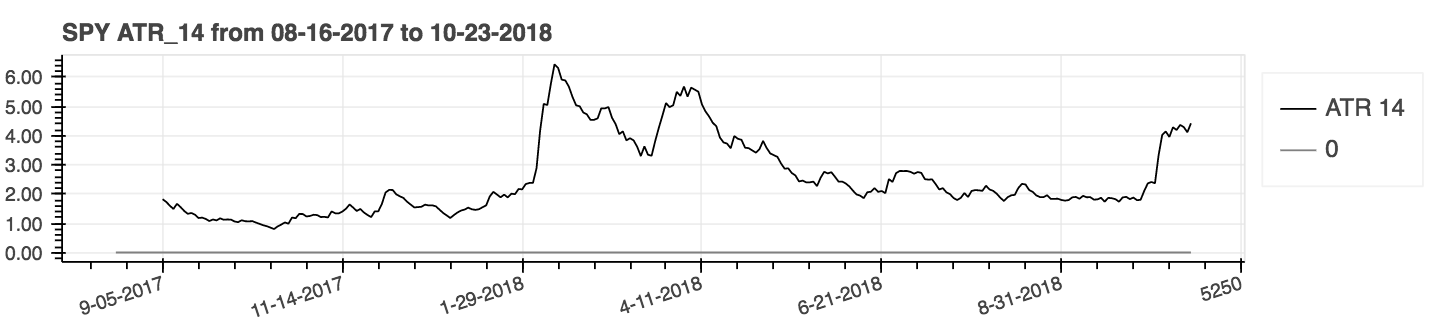 |
<br/>
### **Volume** (15)
* _Accumulation/Distribution Index_: **ad**
* _Accumulation/Distribution Oscillator_: **adosc**
* _Archer On-Balance Volume_: **aobv**
* _Chaikin Money Flow_: **cmf**
* _Elder's Force Index_: **efi**
* _Ease of Movement_: **eom**
* _Klinger Volume Oscillator_: **kvo**
* _Money Flow Index_: **mfi**
* _Negative Volume Index_: **nvi**
* _On-Balance Volume_: **obv**
* _Positive Volume Index_: **pvi**
* _Price-Volume_: **pvol**
* _Price Volume Rank_: **pvr**
* _Price Volume Trend_: **pvt**
* _Volume Profile_: **vp**
| _On-Balance Volume_ (OBV) |
|:--------:|
| 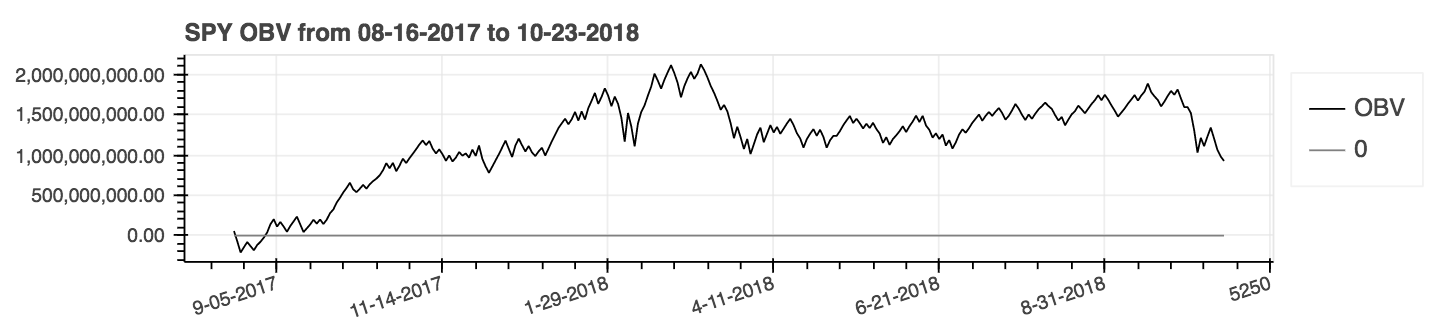 |
<br/><br/>
# **Performance Metrics** _BETA_
_Performance Metrics_ are a **new** addition to the package and consequentially are likely unreliable. **Use at your own risk.** These metrics return a _float_ and are _not_ part of the _DataFrame_ Extension. They are called the Standard way. For Example:
```python
import pandas_ta as ta
result = ta.cagr(df.close)
Available Metrics
- Compounded Annual Growth Rate: cagr
- Calmar Ratio: calmar_ratio
- Downside Deviation: downside_deviation
- Jensen’s Alpha: jensens_alpha
- Log Max Drawdown: log_max_drawdown
- Max Drawdown: max_drawdown
- Pure Profit Score: pure_profit_score
- Sharpe Ratio: sharpe_ratio
- Sortino Ratio: sortino_ratio
- Volatility: volatility
Backtesting with vectorbt
For easier integration with vectorbt’s Portfolio from_signals method, the ta.trend_return method has been replaced with ta.tsignals method to simplify the generation of trading signals. For a comprehensive example, see the example Jupyter Notebook VectorBT Backtest with Pandas TA in the examples directory.
Brief example
- See the vectorbt website more options and examples. ```python import pandas as pd import pandas_ta as ta import vectorbt as vbt
df = pd.DataFrame().ta.ticker(“AAPL”) # requires ‘yfinance’ installed
Create the “Golden Cross”
df[“GC”] = df.ta.sma(50, append=True) > df.ta.sma(200, append=True)
Create boolean Signals(TS_Entries, TS_Exits) for vectorbt
golden = df.ta.tsignals(df.GC, asbool=True, append=True)
Sanity Check (Ensure data exists)
print(df)
Create the Signals Portfolio
pf = vbt.Portfolio.from_signals(df.close, entries=golden.TS_Entries, exits=golden.TS_Exits, freq=”D”, init_cash=100_000, fees=0.0025, slippage=0.0025)
Print Portfolio Stats and Return Stats
print(pf.stats()) print(pf.returns_stats()) ```
Changes
General
- A Strategy Class to help name and group your favorite indicators.
- If a TA Lib is already installed, Pandas TA will run TA Lib’s version. (BETA)
- Some indicators have had their
mamodekwarg updated with more moving average choices with the Moving Average Utility functionta.ma(). For simplicity, all choices are single source moving averages. This is primarily an internal utility used by indicators that have amamodekwarg. This includes indicators: accbands, amat, aobv, atr, bbands, bias, efi, hilo, kc, natr, qqe, rvi, and thermo; the defaultmamodeparameters have not changed. However,ta.ma()can be used by the user as well if needed. For more information:help(ta.ma)- Moving Average Choices: dema, ema, fwma, hma, linreg, midpoint, pwma, rma, sinwma, sma, swma, t3, tema, trima, vidya, wma, zlma.
- An experimental and independent Watchlist Class located in the Examples Directory that can be used in conjunction with the new Strategy Class.
- Linear Regression (linear_regression) is a new utility method for Simple Linear Regression using Numpy or Scikit Learn’s implementation.
- Added utility/convience function,
to_utc, to convert the DataFrame index to UTC. See:help(ta.to_utc)Now as a Pandas TA DataFrame Property to easily convert the DataFrame index to UTC.
Breaking / Depreciated Indicators
- Trend Return (trend_return) has been removed and replaced with tsignals. When given a trend Series like
close > sma(close, 50)it returns the Trend, Trade Entries and Trade Exits of that trend to make it compatible with vectorbt by settingasbool=Trueto get boolean Trade Entries and Exits. Seehelp(ta.tsignals)
New Indicators
- Arnaud Legoux Moving Average (alma) uses the curve of the Normal (Gauss) distribution to allow regulating the smoothness and high sensitivity of the indicator. See:
help(ta.alma)trading account, or fund. Seehelp(ta.drawdown) - Candle Patterns (cdl_pattern) If TA Lib is installed, then all those Candle Patterns are available. See the list and examples above on how to call the patterns. See
help(ta.cdl_pattern) - Candle Z Score (cdl_z) normalizes OHLC Candles with a rolling Z Score. See
help(ta.cdl_z) - Correlation Trend Indicator (cti) is an oscillator created by John Ehler in 2020. See
help(ta.cti) - Cross Signals (xsignals) was created by Kevin Johnson. It is a wrapper of Trade Signals that returns Trends, Trades, Entries and Exits. Cross Signals are commonly used for bbands, rsi, zscore crossing some value either above or below two values at different times. See
help(ta.xsignals) - Directional Movement (dm) developed by J. Welles Wilder in 1978 attempts to determine which direction the price of an asset is moving. See
help(ta.dm) - Even Better Sinewave (ebsw) measures market cycles and uses a low pass filter to remove noise. See:
help(ta.ebsw) - Jurik Moving Average (jma) attempts to eliminate noise to see the “true” underlying activity.. See:
help(ta.jma) - Klinger Volume Oscillator (kvo) was developed by Stephen J. Klinger. It is designed to predict price reversals in a market by comparing volume to price.. See
help(ta.kvo) - Schaff Trend Cycle (stc) is an evolution of the popular MACD incorportating two cascaded stochastic calculations with additional smoothing. See
help(ta.stc) - Squeeze Pro (squeeze_pro) is an extended version of “TTM Squeeze” from John Carter. See
help(ta.squeeze_pro) - Tom DeMark’s Sequential (td_seq) attempts to identify a price point where an uptrend or a downtrend exhausts itself and reverses. Currently exlcuded from
df.ta.strategy()for performance reasons. Seehelp(ta.td_seq) - Think or Swim Standard Deviation All (tos_stdevall) indicator which
returns the standard deviation of data for the entire plot or for the interval
of the last bars defined by the length parameter. See
help(ta.tos_stdevall) - Vertical Horizontal Filter (vhf) was created by Adam White to identify trending and ranging markets.. See
help(ta.vhf)
Updated Indicators
- Acceleration Bands (accbands) Argument
mamoderenamed tomode. Seehelp(ta.accbands). - ADX (adx): Added
mamodewith default “RMA” and with the samemamodeoptions as TradingView. New argumentlensigso it behaves like TradingView’s builtin ADX indicator. Seehelp(ta.adx). - Archer Moving Averages Trends (amat): Added
driftargument and more descriptive column names. - Average True Range (atr): The default
mamodeis now “RMA” and with the samemamodeoptions as TradingView. Seehelp(ta.atr). - Bollinger Bands (bbands): New argument
ddoffto control the Degrees of Freedom. Also included BB Percent (BBP) as the final column. Default is 0. Seehelp(ta.bbands). - Choppiness Index (chop): New argument
lnto use Natural Logarithm (True) instead of the Standard Logarithm (False). Default is False. Seehelp(ta.chop). - Chande Kroll Stop (cksp): Added
tvmodewith defaultTrue. Whentvmode=False, cksp implements “The New Technical Trader” with default values. Seehelp(ta.cksp). - Chande Momentum Oscillator (cmo): New argument
talibwill use TA Lib’s version and if TA Lib is installed. Default is True. Seehelp(ta.cmo). - Decreasing (decreasing): New argument
strictchecks if the series is continuously decreasing over periodlengthwith a faster calculation. Default:False. Thepercentargument has also been added with default None. Seehelp(ta.decreasing). - Increasing (increasing): New argument
strictchecks if the series is continuously increasing over periodlengthwith a faster calculation. Default:False. Thepercentargument has also been added with default None. Seehelp(ta.increasing). - Klinger Volume Oscillator (kvo): Implements TradingView’s Klinger Volume Oscillator version. See
help(ta.kvo). - Linear Regression (linreg): Checks numpy’s version to determine whether to utilize the
as_stridedmethod or the newersliding_window_viewmethod. This should resolve Issues with Google Colab and it’s delayed dependency updates as well as TensorFlow’s dependencies as discussed in Issues #285 and #329. - Moving Average Convergence Divergence (macd): New argument
asmodeenables AS version of MACD. Default is False. Seehelp(ta.macd). - Parabolic Stop and Reverse (psar): Bug fix and adjustment to match TradingView’s
sar. New argumentaf0to initialize the Acceleration Factor. Seehelp(ta.psar). - Percentage Price Oscillator (ppo): Included new argument
mamodeas an option. Default is sma to match TA Lib. Seehelp(ta.ppo). - True Strength Index (tsi): Added
signalwith default13and Signal MA Modemamodewith default ema as arguments. Seehelp(ta.tsi). - Volume Profile (vp): Calculation improvements. See Pull Request #320 See
help(ta.vp). - Volume Weighted Moving Average (vwma): Fixed bug in DataFrame Extension call. See
help(ta.vwma). - Volume Weighted Average Price (vwap): Added a new parameter called
anchor. Default: “D” for “Daily”. See Timeseries Offset Aliases for additional options. Requires the DataFrame index to be a DatetimeIndex. Seehelp(ta.vwap). - Volume Weighted Moving Average (vwma): Fixed bug in DataFrame Extension call. See
help(ta.vwma). - Z Score (zscore): Changed return column name from
Z_lengthtoZS_length. Seehelp(ta.zscore).
Sources
Original TA-LIB | TradingView | Sierra Chart | MQL5 | FM Labs | Pro Real Code | User 42
Support
Feeling generous, like the package or want to see it become more a mature package?
Consider
